Comparing Finite Element Analysis with the FHWA Load Rating Method for Gusset Plate Connections in Truss Bridge
After the collapse of the I-35W Bridge in Minneapolis, Minnesota in 2007, the Federal Highway Administration (FHWA) standards for bridge load ratings were updated to include gusset plates. The methods provided to evaluate tensile capacity may also be found in the 2010 AASHTO code; they are the Whitmore method and the block shear method. The Whitmore method is based on an elastic analysis conducted in 1952, and the block shear method is based on a capacity analysis conducted in 1984. While these methods give an estimate of plate capacity, they do not explain plate behavior, nor have they been applied to other connection geometries.
In this research project, the original Whitmore experiment has been modeled with Abaqus (figure 1), and stress distributions were compared for verification (Figure 2). The Von Mises stress, which governs the onset of plasticity, has a very different distribution from the maximum principle stress. Although the lower chord is continuous, high stresses are found around the lower chord bolt holes because of the magnitude of their loads. The results of this linear elastic analysis served as predictions for a nonlinear capacity analysis (figure 3). The finite element method allows engineers to view a system as a whole, rather than on a member-by-member basis as proscribed by the FHWA inspection manual. It is hoped that the information provided by this analysis will assist design engineers and load rating engineers in the preservation and maintenance of historic truss bridges in the U.S., such as the connection model in figure 4.
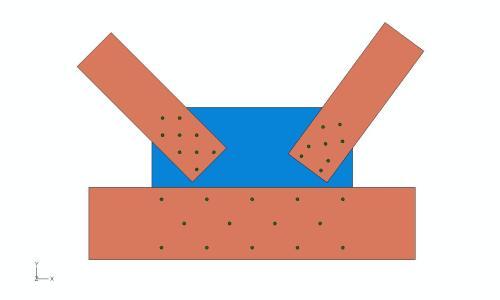
Figure 1. Finite element model of the 1952 Whitmore experiment
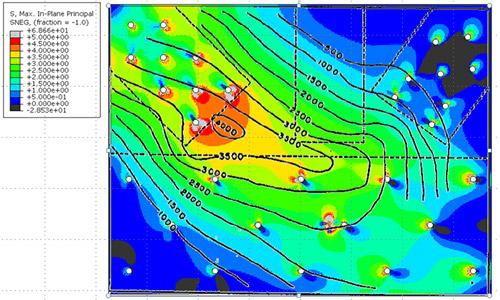
Figure 2. Whitmore Contours of Maximum Principle Stress (Lines) Overlain on Finite Element Stress Contours (Colors)
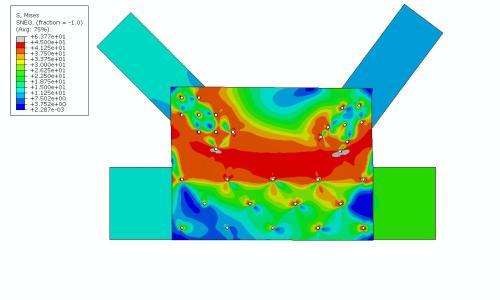
Figure 3. Von Mises stress in nonlinear capacity model
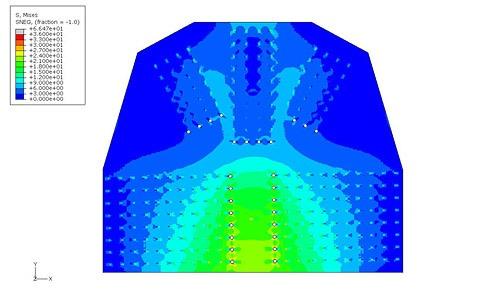
Figure 4. Von Mises Stress Contours of a Representative Midspan Gusset Plate