Effects of Ambient Temperature on Modal Parameters
Research Team: Babak Moaveni (PI), Peter Moser (grad student)
Funding: N/A
Duration: 3/2010 – 6/2011
Relevant publications to date:
Moser, P., and Moaveni, B. (2011). "Environmental effects on the identified natural frequencies of the Dowling Hall Footbridge." Mechanical Systems and Signal Processing, 25(7), 2336-2357.
The modal parameters are often sensitive to changing environmental conditions such as temperature, humidity, or excitation amplitude. Environmental conditions can have as large an effect on the modal parameters as significant structural damage, so these effects should be accounted for before applying damage identification methods.
Figure 1 shows the identified natural frequencies of the six identified modes versus the temperature of the northern abutment (C1) for the Dowling Hall Footbridge at Tufts University campus. Correlation between natural frequencies and temperatures is evident: higher natural frequencies generally occur at lower temperatures. From this figure it can be observed that: (1) the identified natural frequencies increase as temperatures decrease, (2) this effect is more significant when the temperatures are below the freezing point resulting in a nonlinear relationship, and (3) Modes 1, 3, and 4 show more clear correlation with temperature while Modes 2, 5, and 6 show more scatter. One explanation for the third observation is that Modes 2, 5, and 6 are identified with larger estimation uncertainties as seen in Figure 1.
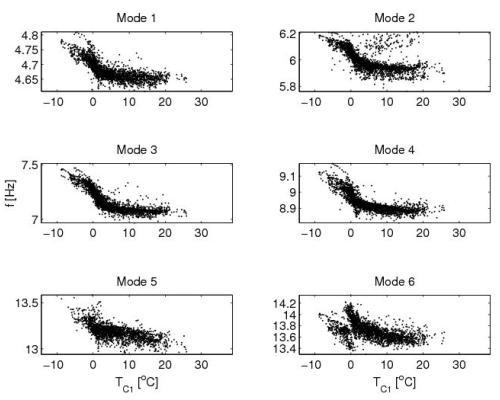
Figure 1. Identified natural frequencies versus western abutment temperature C1
Several nonlinear models are proposed to represent the relationship between the identified natural frequencies and measured temperatures. Due to the high correlation between some temperature records, only three records were used to model the relationship between the identified six natural frequencies and the measured temperatures. The three temperature measurements which gave the best results for modeling were S3 (temperature of the steel frame), C2 (temperature of the concrete deck) and C1 (temperature of the western abutment). The fact that these three variables gave the best model suggests the structural frame, the concrete deck, and the boundary conditions all significantly affect the dynamics of this bridge. After evaluating many candidate models (including a static linear model, an ARX model, a bi-linear model, and polynomials of various orders) a fourth-order polynomial static model was selected. The fourth-order model with no cross terms was selected as the best practical model for the relationship between natural frequencies and temperatures. Figure 2 compares the identified natural frequencies with those simulated using the model, indicating that the model fits the data well.
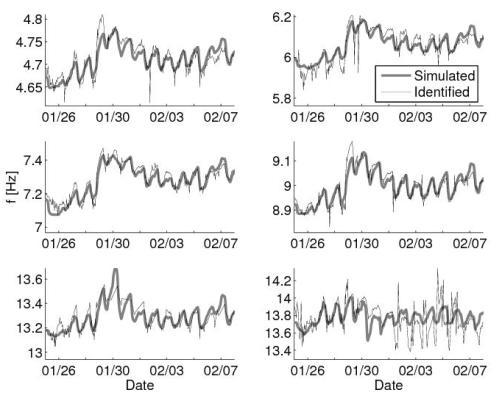
Figure 2. Time-variation of identified and fourth-order model simulated natural frequencies of all six modes between January 25 and February 8, 2010
The fourth-order model presented can also be used to generate confidence intervals around simulated natural frequencies based on the error variance and the covariance of the temperature inputs. Figure 3 shows the identified and simulated natural frequencies simulated using the fourth-order model during the period between March 15 and March 29, together with the 95% confidence intervals for the natural frequencies. The confidence intervals are indicated by the gray shaded region, with the simulated natural frequency indicated by a darker gray line. Data points which fall outside the confidence interval are shown with a filled circle. Note that the width of the confidence interval compared to the total variability in natural frequency is an indicator of the accuracy of the model for each mode. Across the data shown, the simulated natural frequency and confidence intervals generally match the data, and outliers are scattered rather than concentrated.
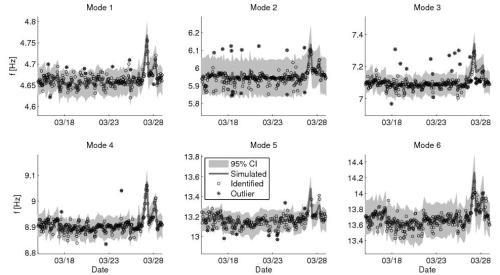
Figure 3. Identified and simulated natural frequencies between March 15 and 29 using the fourth-order model without cross terms, together with the 95% Confidence Interval (CI) and the outliers.
Confidence intervals provide a simple means of identifying damage: if a future natural frequency develops a trend outside the confidence intervals established for the corresponding temperatures it is likely that the bridge has experienced structural change.