Simulation of Damage on the Dowling Hall Footbridge
Research Team: Babak Moaveni (PI), Alyssa Kody (undergrad student)
Funding: Tufts Summer Scholars, NSF-BRIGE (1125624)
Duration: 4/2011 - 12/2011
Relevant publications to date:
The objective of this project was to simulate damage on the Dowling Hall Footbridge without compromising the safety of this structure. This is done by increasing the mass of the bridge. Damage to a bridge is often caused by a loss of stiffness, which can be detected through changes in natural frequencies. By increasing the mass of the bridge, the frequency of the bridge will decrease, simulating damage (a loss of stiffness) to the bridge without actually harming the structure. To determine the best location and distribution of the added mass, a finite element (FE) model of the Dowling Hall Footbridge was developed to analyze the changes in natural frequencies due to the addition of mass at different locations and with different distributions. The FE model was developed in SAP2000, a structural analysis software, as shown in Figure 1. Using this model, the effect of additional mass on the natural frequencies of the footbridge was studied.
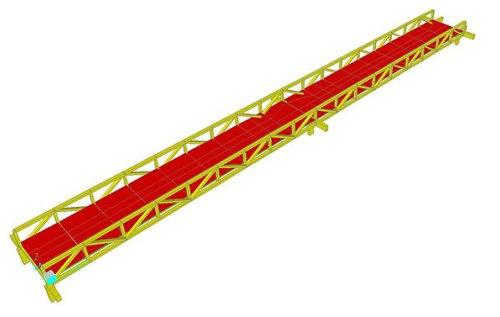
Figure 1. A finite element model of the Dowling Hall Footbridge in SAP2000
The FE model of the Dowling Hall Footbridge was used to determine the location of the mass where the natural frequencies would have the greatest percent change. During analysis, added masses were applied as point masses to the joints of shell elements representing the deck and in a manner that is equivalent to a distributed load. The total mass was divided so that each side of the bridge would hold half the total mass. For example, for a 5-kips total mass, each side of the bridge would hold 2.5-kips. Analyses with various total masses (2-kips, 5-kips, 6-kips), and distribution lengths (8-ft, 16-ft, 24-ft) were performed. Figure 2 shows the percent change in natural frequencies versus the location of a 5-kip applied mass along a 16-ft length on each side of the bridge. Station 0-ft is the upper campus side support, 72-ft is the support at middle pier, and 144-ft is the support at the Dowling Hall side. Through these analyses, the smallest changes in the natural frequencies resulted from placing the mass on or next to the supports. The highest changes in natural frequency are observed when the mass is placed in the middle of a span. Because 6 of the 8 accelerometers on the Dowling Hall Footbridge are located between the campus-side abutment and middle pier, more accurate identification results can be obtained by placing the mass on this span rather than on the span closer to Dowling Hall.
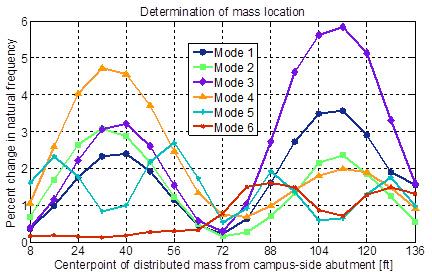
Figure 2. Changes in natural frequencies versus location of distributed 5-kip mass
The FE model of the Dowling Hall Footbridge was also used to determine the smallest mass required to observe changes in the measured natural frequencies. If the chosen total mass is too small, its effects would be overshadowed by measurement noise or identification errors. If the chosen total mass is too large, it may pose a threat to pedestrians, cause structural damage, or be too difficult to move onto the bridge.
For the FE model analysis, masses ranging from 1-kip to 9-kips were considered, and the percent change in natural frequencies were compared among them (Figure 3). Reviewing the percent change in natural frequency, a 5-kip mass would produce the necessary changes in frequencies so that three of the first six vertical modes would be outside the ambient variability ranges outlined by Moser and Moaveni (2011) (Mode 2 = 6.03 Hz ±3%, Mode 3 = 7.25 Hz ±4%, Mode 4 = 8.99 Hz ±3%). Hence, adding a 5-kip distributed mass over the proposed area was expected to result in observable changes in the natural frequencies in the presence of noise and estimation error. A 5-kip mass is also a reasonable amount to add to the bridge, as it could be moved on and off the bridge relatively easily, and would not take up too much walking area on the deck of the bridge.
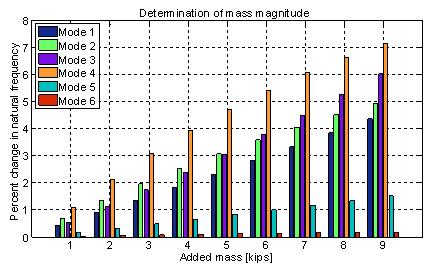
Figure 3. Percent change in natural frequencies for various total masses
Table 1 shows the predicted natural frequencies and percent change in natural frequency due to the addition of 5000-lbs distributed along the sides of the bridge. Each side of the bridge holds 2500-lbs distributed over a 16-ft length. These predictions were made assuming the mass is placed between 24-ft and 40-ft from the campus-side abutment. Figure 4 shows the loading plan for the Dowling Hall Footbridge using concrete blocks.
Table 1. Predicted natural frequencies and percent change in natural frequency due to mass
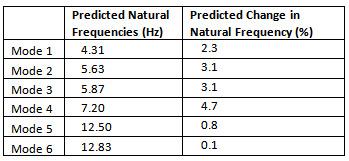
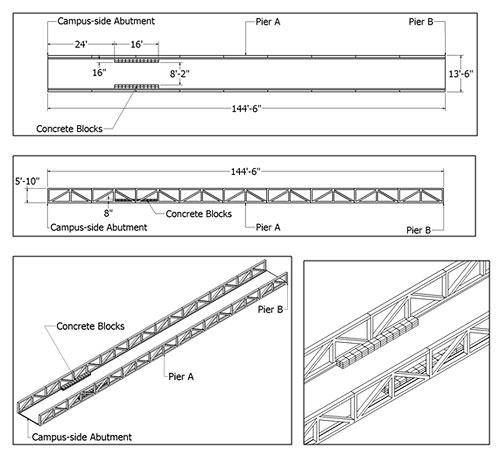
Figure 4. Sketches of the loading plan
Table 2 reports the identification success rate, a percentage representing how many times a mode was correctly identified during the test loading (72 hours). Mode 1 was identified the least (71%), while mode 4 was identified the most (100%). All other modes were identified between 98% and 99%. This result is consistent with long-term indentification success rates. Moser and Moaveni (2011) identified mode 4 as the most reliably identified mode (99%), and mode 1 as having one of the lowest identification success rates (86%).
Table 2. Identification success rate during the load test
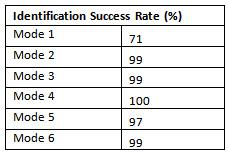
Figure 5 shows the natural frequencies of the six modes using hourly measured data from July 28, 2011 to August 3, 2011. Natural frequencies from data collected without the mass are shown in blue and those from data collected with the mass on the deck are shown in red. Due to the addition of the mass, there is a clear decrease in the identified natural frequencies of modes 1-4, but modes 5-6 do not show a clear trend due to addition of the mass. To determine the percent change in the identified natural frequencies, the mean natural frequency for each mode was calculated using data points from July 29 at 14:00 to August 1 at 11:00 (the time period when the entire mass was on the deck). These values were then compared to the mean frequencies from the day before the test, July 28, from 0:00 to 23:00. Data from the test loading was compared to the July 28 data because factors that affect the natural frequency, such as environmental factors, would most closely match the conditions of the test loading. Table 3 lists the mean natural frequencies for each mode on July 28, the mean frequencies from the test loading, and the percent difference between the two. Mean natural frequencies of the first four modes are significantly reduced due to the addition of mass with maximum decrease in the second mode (7.4%).
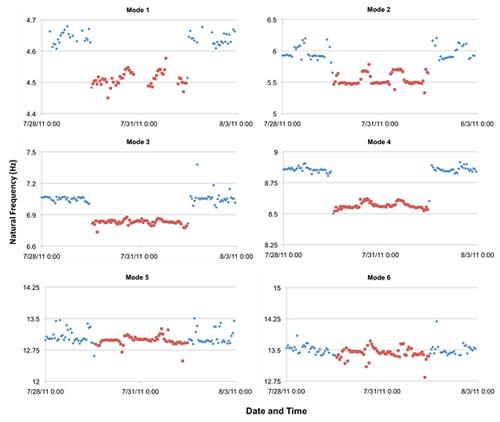
Figure 5. Identified natural frequencies versus time
Table 3. Mean identified natural frequencies with and without the added mass
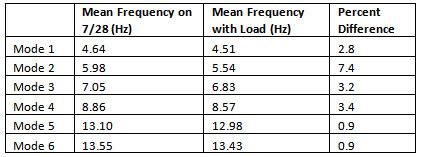
Table 4 and Figure 6 compare the reduction in natural frequencies of the six vibration modes estimated from the FE model versus those identified from experimentally measured data (mean value reduction). The FE model predicted that mode 4 would have the highest percent change in natural frequency with 4.72%. The model also predicted that modes 5 and 6 would have the lowest percent change in natual frequencies with less than 1% change. The model predicted that the percent change in natural frequency for modes 1, 2, and 3 would fall in the range of 2 to 4 percent. The actual reduction in the identified natural frequencies of modes 1, 3, and 5 are very close to their FE model predicted counterparts. The measured reduction in modes 4 and 6 is slightly different from model predictions but is within an acceptable range. The largest discrepancy between FE predicted and experimentally identified natural frequency reduction due to the addition of mass is observed for mode 2 (3.07% versus 7.41%). This could be due to some modeling error as well as larger identification uncertainty/variability of this mode (see variation of this natural frequency in Figure 5).
Table 4. Comparison between FE predicted and experimentally identified reduction in natural frequencies due to addition of mass
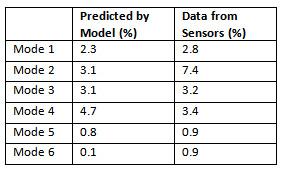
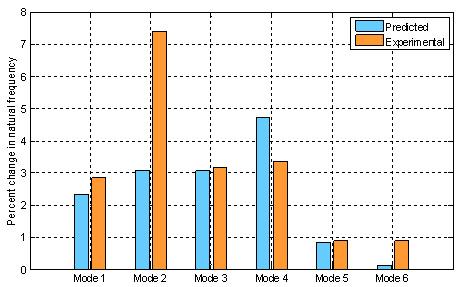
Figure 6. Percent reduction in natural frequencies of the six modes: FE model versus mean identified
This experiment provides a unique dataset that can be used by researchers at Tufts and other universities to verify different vibration-based damage identification and structural health monitoring methodologies. In addition, this data set can be used in SHM courses to demonstrate damage identification of a real-world structure.